


UX Lite Survey Method – Too Good To Be True? It Might Not Be!
In this article, I discuss the claims around how a 2 question survey format can provide the same value as a 10 question survey, and what results I gathered from testing them against each other.

Intro to Usability Metrics and SUS
If you are a blank slate UXR or product professional and your organization comes to you with a desire to get benchmark scores on their software’s usability over time, a few minutes of google searching will most likely lead you to the System Usability Score (SUS). This survey method was created in 1986 by John Brooke, and it is the most widely documented/peer reviewed survey of its kind.
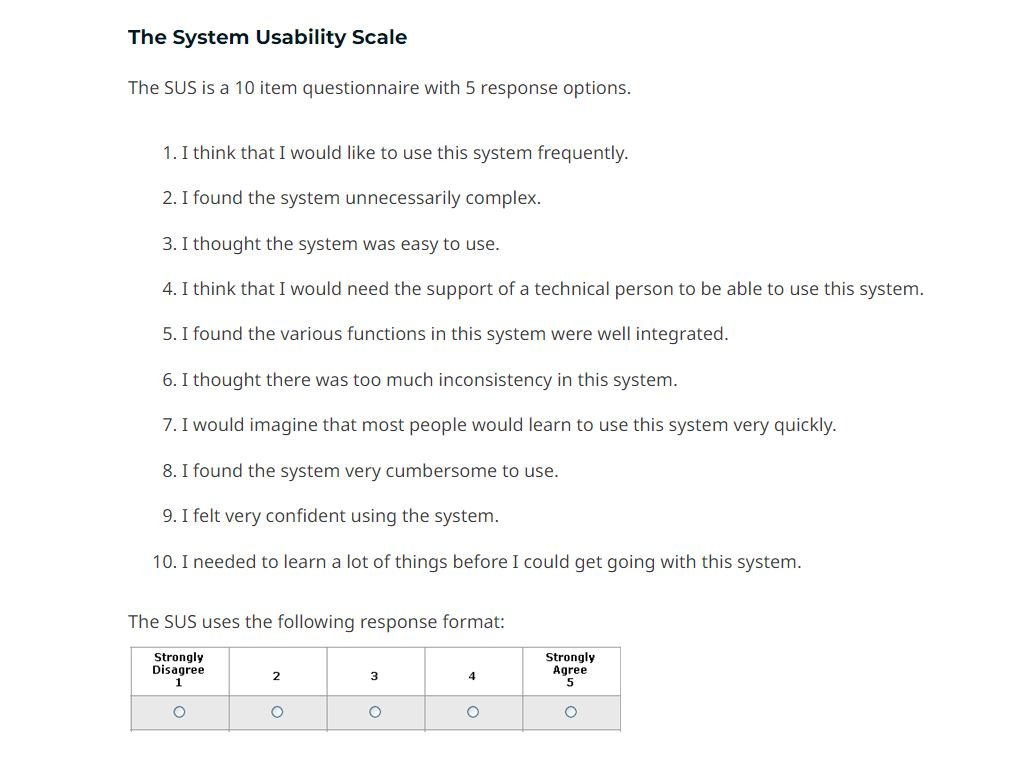
The SUS survey format consists of 10 items, each rated on a 5-point Likert scale, that assess the user's perception of the system's usability. The SUS survey format is designed to be quick and easy to administer, making it an attractive option for businesses looking to gather user feedback. The responses are then standardized and converted to a score out of 100, allowing for easy comparison between different systems. They look a little something like this:
Alternatives - UX Lite
In more recent years, MeasuringU.com has conducted extensive research on alternatives to the SUS format, including UMUX and UX lite. The UX lite survey caught my attention because it involves using a 2 question format. The research has found that the UX lite survey method is a valid and reliable tool for measuring the overall perception of usability. The method has been shown to produce results that are comparable to those of longer surveys, like SUS, while being more efficient and cost-effective, making it an attractive option for businesses looking to gather user feedback. It looks a little something like this:

An opportunity arose for me to pit SUS against UX lite in a software in which the end user’s time was their most valuable asset. I was very keen on seeing if I could replicate the claims made through research about UX lite, and confirm if it could really accomplish the same richness of data that the SUS format can in a much lower lift for the survey taker.

The way I accomplished this was to A/B test the two formats. I did not do a traditional A/B test where the survey format presented was randomized; but instead split evenly between the two surveys in which they alternated appearing (this distinction will be relevant later in my article). Simply put, when participant 1 clicked on the distribution link, they saw the SUS format. And when participant 2 clicked on the same link, the survey building tool would diverge their path and they would see the UX lite format.
Results
In an effort to keep the project material confidential, I will only be reporting on the comparison of the two survey methods and how my experience stacked up to the research I had read. With the A/B tested survey, I achieved a sample size high enough for both formats to achieve statistical significance. Here is what I found:
Even when presented evenly, the SUS survey accounted for 45 percent of the total responses, while the UX lite accounted for the other 55 percent.
This suggests that the SUS survey was abandoned at a higher rate.
When the UX lite score was normalized to the same 100 point scale as the SUS, the scores fell within 1 point of each other.1
The confidence interval of both survey’s results were approximately 5 and 6 points respectively.
On an 100 point grading scale, this meant that we could look at both of these scores at the same level of accuracy.
When you pull the third question out of the SUS format and score it on its own, the total is the exact same as when scored with the other 9 questions.
This is significant because the third question in SUS and the first question of UX lite are the same. It is the ease question: “Blank product is easy to use.”
So, what does all this math mean?
In the case of this research initiative and particular software, the claims made earlier in this article were completely validated. The UX lite format produced near identical data of similar quality as the SUS, all while doing it in a 2 question format. It may not seem like much, but changing survey sizes from 10 questions to 2 questions will remove a lot of time and awkwardness. However small, users give up a portion of their day to take these surveys in the hopes that their opinion will make a difference. Therefore, it is important to always balance the amount of data needed to make decisions with the lift that we require from them to complete the task.
Conclusion
To reemphasize, this experiment validated the use of the UX lite survey format completely with this product and its user base of very busy people. The key words there being this product. My recommendation, as well as the recommendation of many other researchers advocating for the UX lite, is that you listen to the needs of your stakeholders and understand how you will be testing, and apply your method accordingly.
That being said, if you are at an organization running repeated SUS surveys and you think you would find benefits running UX lite like I did, then I challenge you to run the surveys in parallel and see what you discover! The research behind it is promising enough to take at face value, but there is nothing more exciting than finding supporting evidence for a case yourself. If you read this and decide to try it for yourself, please reach back out and let me know how your initiative went. I would love to chat more about this topic and the nuances that come with it.
You can either leave a comment on this post, or subscribe for free and join the subscriber chat. Thank you all for reading, and if you liked this article or you know of someone else who would, please feel free to share this post with them using the button below.
If you want to see how this is done read this article from MeasuringU.